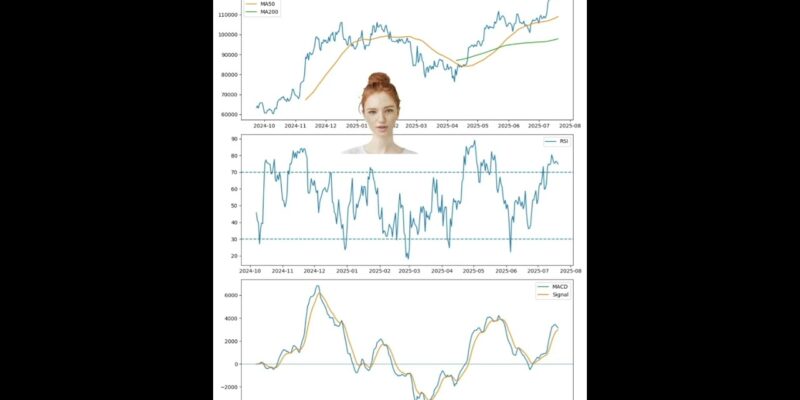
Welcome back to Crypto Brain AI! In today’s video, we dive into Bitcoin’s incredible 22.8% rally over the past six months—from around $64,000 in January to nearly $118,000 in July. Using powerful AI-driven analysis, we break down three key technical indicators:
• 14-Day RSI: Identify optimal buy-on-dip levels
• MACD Oscillator: Confirm momentum shifts
• Golden Cross (50/200-Day MA): Spot long-term bullish trends
Watch as we visualize price action, moving averages, RSI, and MACD in one clear chart—and discover our data-backed buy-or-wait recommendation.
🔔 **Subscribe** for weekly AI-powered crypto insights
👍 **Like** if you found this breakdown useful
💬 **Comment** below with your questions or Bitcoin predictions
#Bitcoin
#Crypto
#CryptoTrading
#CryptoAnalysis
#AI
#MachineLearning
#TechnicalAnalysis
#RSI
#MACD
#GoldenCross
#CryptoBrainAI
#Blockchain